Ideal Gas Law Activity
Follow this link for the activity and the instructions: link
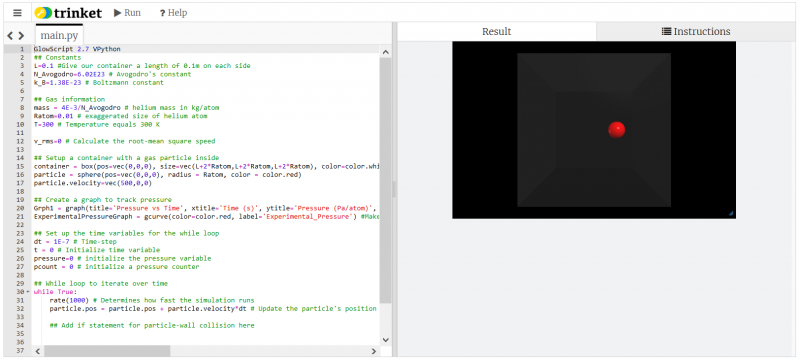
Or, read the instructions after the image below, and copy the code into your own GlowScript file.
You should see something that looks like this:
If you click on the “Instructions” tab in the upper right, a set of instructions for the activity should pop up. Click between “Instructions” and “Result” to alternately view the instructions and the animation. If you prefer, the same instructions are also listed below.
- Try runnning your code. You'll notice that our gas particle is currently escaping the box.
- Add an 'if' statement to check for when the gas particle collides with a wall, and make the particle move in th opposite direction after contacting the wall.
- Enter the equation for v_rms of a gas particle and correct that value in your particle's velocity.
- The pressure of an ideal gas comes from collisions between particles and the walls of the container. The pressure is equal to the force (mass times delta_velocity) divided by the area. Add a line to the code that calculates the pressure from our gas atom colliding with the wall.
- Hint: Everytime that a particle-wall collision occurs, you should increase your pcount, and then average the total pressure by dividing by pcount.
- Try to create a pressure vs. time graph that adds another data point for every particle-wall collision. In this simplified model, the pressure versus time graph should be horizontal.
- For an extra challenge, try making the particle collisions work in three dimensions. This will build into a more complicated model to be used later.
For more information on glowscript tools, check out: https://www.glowscript.org/docs/GlowScriptDocs/index.html
GlowScript 2.7 VPython
## Constants
L=0.1 #Give our container a length of 0.1m on each side
N_Avogodro=6.02E23 # Avogodro's constant
k_B=1.38E-23 # Boltzmann constant

## Gas information
mass = 4E-3/N_Avogodro # helium mass in kg/atom
Ratom=0.01 # exaggerated size of helium atom
T=300 # Temperature equals 300 K

v_rms=0 # Calculate the root-mean square speed

## Setup a container with a gas particle inside
container = box(pos=vec(0,0,0), size=vec(L+2*Ratom,L+2*Ratom,L+2*Ratom), color=color.white, opacity=0.1)
particle = sphere(pos=vec(0,0,0), radius = Ratom, color = color.red)
particle.velocity=vec(500,0,0)

## Create a graph to track pressure
Grph1 = graph(title='Pressure vs Time', xtitle='Time (s)', ytitle='Pressure (Pa/atom)', fast=False, ymin=0, ymax=1E-20) #initialize our graphs. Useful boundaries: ymin=0, ymax=5*Theoretical_Pressure
ExperimentalPressureGraph = gcurve(color=color.red, label='Experimental_Pressure') #Make a graph for measured pressure

## Set up the time variables for the while loop
dt = 1E-7 # Time-step
t = 0 # Initialize time variable
pressure=0 # initialize the pressure variable
pcount = 0 # initialize a pressure counter

## While loop to iterate over time
while True:
    rate(1000) # Determines how fast the simulation runs
    particle.pos = particle.pos + particle.velocity*dt # Update the particle's position

    ## Add if statement for particle-wall collision here


    ## Add a graph for experimental pressure here


    t = t + dt
