Activity Information
Learning Goals
- Apply the principles of constant velocity motion in 1d
- Edit a computational model to simulate different scenarios
Prior Knowledge Required
- Vector components
- Constant velocity equation
Code Manipulation
- Copy/Paste code
- Edit existing code
Activity
Handout – Box Race
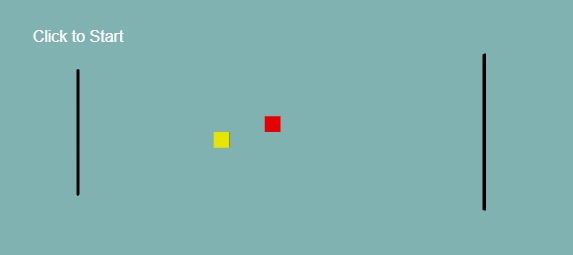
Begin with this starter code in Trinket. Click “remix” to save a copy.
The yellow box is clearly faster than the red box. Your goal is as follows:
1. Change the background color to teal. This link might help: http://bit.ly/glowscriptcolordemo
2. Make the simulation stop when the yellow box gets to the finish line. (There is a finish line, can you find it?) Make the simulation stop by adjusting the While loop.
3. Make it so that the boxes reach the finish line at the exact same time.
Do so by adjusting the starting position of the yellow box.
4. Start the yellow box at the finish line moving left at the same speed that it had previously.
5. Move the yellow box’s vertical position so that it will collide head on with the red box.
6. Make the simulation stop when the two boxes collide in the middle. (try to make it without using calculations, so it would work no matter the speeds of the boxes)
7. Lastly, let’s try something new. Make a position-time graph for the red box in this last situation (the collision).
To do so, delete the # next to the code related to graphs (3 lines total)
Edit the code such that the titles and colors match your data (red car = red line)
Does it look like the position time graph you expected?
8. Now try to get both boxes plotted on one graph.
Come up with your own variation.
Code
GlowScript 2.9 VPython

#get_library('https://rawgit.com/perlatmsu/physutil/master/js/physutil.js')


#Window setup
scene.center = vector(128,0,0)
scene.range=128
scene.width =640
scene.height = 400
scene.background = vector(0.5,0.5,0.5)

#objects
redbox=box(pos=vector(-5,5,0),size=vector(10,10,2),color=vector(1,0,0))
yellowbox=box(pos=vector(-5,-5,0),size=vector(10,10,2),color=vector(1,1,0))

#lines
v1=vector(0,40,0)
v2=vector(0,-40,0)
v3=vector(260,40,0)
v4=vector(260,-40,0)
startingline=curve(pos=[v1,v2],color=vector(0,0,0))
#finishline=curve(pos=[v3,v4],color=vector(0,0,0))
finishline2=box(pos=vector(260,0,0),size=vector(1,100,2),color=vector(0,0,0))

#time and time step
t=0
tf=35
dt = 0.1

#initial conditions
redboxvelocity=vector(4,0,0)
yellowboxvelocity=vector(5,0,0)

#click to start
cts = label(pos=vector(0,60,0), text='Click to Start', space=30, height=16, border=5, font='sans', box=False)
clicktostart = scene.waitfor('click')

#make a graph
#redboxgraph = graph(title = "make it a good title", xtitle = "xtitle [units]", ytitle = "ytitle[units])")
#describe the line for the graph
#f1=gcurve(color=color.blue, markers=True, label= "car 1")

#calculation loop
while t < tf:
    rate(100)

    redbox.pos = redbox.pos + redboxvelocity*dt
    yellowbox.pos = yellowbox.pos + yellowboxvelocity*dt

    t = t + dt
  #adds a point to the graph each iteration
    #f1.plot(t,redbox.pos.x)

print('time = ',t)
print('red position = ',redbox.pos.x)
print('yellow position = ',yellowbox.pos.x)
Answer Key
Handout
This solution has two parts, one for questions 1-3 and another for questions 4-8.
Part 1
1. After finding a suitable color, the vector values in line 11 have to be changed to change the color of the background:
scene.background = vector(0.5,0.7,0.7) Various values other than <0.5,0.7,0.7> can also give a teal.
2. The finish line is located at x = 260, which we can see in line 24. We need to change the condition statement for the while loop so that the loop runs until one of the boxes touches the finish line:
while redbox.pos.x and yellowbox.pos.x < 255:Why 255 and not 260? the boxes are 10 m long in the x-direction, but the computer reads their position from the center of the object, so if we want it to stop whenever it touches the finish line, we have to account for the extra distance that is half the length of the box.
3. To change the starting x position of the yellow box, we have to change the first number in its position vector in line 15. To find the right value, we can either plug in a bunch of numbers to eventually find it, or we can do a bit of math:
Both boxes will reach the finish line at the same time, so they will both be moving for the same amount of time, so we can use the already known starting and ending position of the red box to find this time. To solve for it we can use the constant velocity equation solved for time: t = d/v. The red box will move from x = -5 m to x = 255 m for a total of d = 260 m. It moves with a velocity of 4 m/s (see line 32), so it takes a total of 65 s to reach the finish line
Now that we have the right time, we can use the constant velocity equation solved for distance: d = vt to find that the yellow box goes 325 m in 65 s. We know we want the final position of the yellow box should be 255 and x(final) – x(initial) = d, so we can solve for x(initial), which ends up being – 70:
yellowbox=box(pos=vector(-70,-5,0),size=vector(10,10,2),color=vector(1,1,0))Part 2
4. To start the box at the finish line, we need to change its x-position to 265 and to make it move to the left we can simply put a negative sign in front of the x-component of its velocity.
5. To do this, we can change the y-position of the box to 5.
6. To do this, we need to change the condition statement of the while loop again. We need to check to see if the boxes touch each other, which means their positions can’t get closer than 10 m to each other. In the code this looks like:
while abs(redbox.pos.x-yellowbox.pos.x) > 10:abs() is used so this statement works in any direction.
7. After un-commenting the graph code, we can add a second plot on the graph called f2:
f1=gcurve(color=color.red, markers=True, label= "car 1") # colors have been chagned appropriatley
f2=gcurve(color=color.yellow, markers=True, label= "car 2")
Now this graph needs to be plotted in the while loop:
 f1.plot(t,redbox.pos.x)
 f2.plot(t,yellowbox.pos.x)
8. Covered in 7.
Code
Part 1 code:
GlowScript 2.9 VPython

#get_library('https://rawgit.com/perlatmsu/physutil/master/js/physutil.js')


#Window setup
scene.center = vector(128,0,0)
scene.range=128
scene.width =640
scene.height = 400
scene.background = vector(0.5,0.7,0.7)

#objects
redbox=box(pos=vector(-5,5,0),size=vector(10,10,2),color=vector(1,0,0))
yellowbox=box(pos=vector(-70,-5,0),size=vector(10,10,2),color=vector(1,1,0))

#lines
v1=vector(0,40,0)
v2=vector(0,-40,0)
v3=vector(260,40,0)
v4=vector(260,-40,0)
startingline=curve(pos=[v1,v2],color=vector(0,0,0))
#finishline=curve(pos=[v3,v4],color=vector(0,0,0))
finishline2=box(pos=vector(260,0,0),size=vector(1,100,2),color=vector(0,0,0))

#time and time step
t=0
tf=35
dt = 0.1

#initial conditions
redboxvelocity=vector(4,0,0)
yellowboxvelocity=vector(5,0,0)

#click to start
cts = label(pos=vector(0,60,0), text='Click to Start', space=30, height=16, border=5, font='sans', box=False)
clicktostart = scene.waitfor('click')

#make a graph
redboxgraph = graph(title = "x positions of cars vs time", xtitle = "time [s]", ytitle = "x position [m]")
#describe the line for the graph
f1=gcurve(color=color.red, markers=True, label= "car 1")
f2=gcurve(color=color.yellow, markers=True, label= "car 2")

#calculation loop
while redbox.pos.x and yellowbox.pos.x < 255:
    rate(100)

    redbox.pos = redbox.pos + redboxvelocity*dt
    yellowbox.pos = yellowbox.pos + yellowboxvelocity*dt

    t = t + dt
  #adds a point to the graph each iteration
    f1.plot(t,redbox.pos.x)
    f2.plot(t,yellowbox.pos.x)

print('time = ',t)
print('red position = ',redbox.pos.x)
print('yellow position = ',yellowbox.pos.x)
Part 2 code:
GlowScript 2.9 VPython

#get_library('https://rawgit.com/perlatmsu/physutil/master/js/physutil.js')


#Window setup
scene.center = vector(128,0,0)
scene.range=128
scene.width =640
scene.height = 400
scene.background = vector(0.5,0.7,0.7)

#objects
redbox=box(pos=vector(-5,5,0),size=vector(10,10,2),color=vector(1,0,0))
yellowbox=box(pos=vector(265,5,0),size=vector(10,10,2),color=vector(1,1,0))

#lines
v1=vector(0,40,0)
v2=vector(0,-40,0)
v3=vector(260,40,0)
v4=vector(260,-40,0)
startingline=curve(pos=[v1,v2],color=vector(0,0,0))
#finishline=curve(pos=[v3,v4],color=vector(0,0,0))
finishline2=box(pos=vector(260,0,0),size=vector(1,100,2),color=vector(0,0,0))

#time and time step
t=0
tf=35
dt = 0.1

#initial conditions
redboxvelocity=vector(4,0,0)
yellowboxvelocity=vector(-5,0,0)

#click to start
cts = label(pos=vector(0,60,0), text='Click to Start', space=30, height=16, border=5, font='sans', box=False)
clicktostart = scene.waitfor('click')

#make a graph
redboxgraph = graph(title = "x positions of cars vs time", xtitle = "time [s]", ytitle = "x position [m]")
#describe the line for the graph
f1=gcurve(color=color.red, markers=True, label= "car 1")
f2=gcurve(color=color.yellow, markers=True, label= "car 2")

#calculation loop
while abs(redbox.pos.x-yellowbox.pos.x) > 10:
    rate(100)

    redbox.pos = redbox.pos + redboxvelocity*dt
    yellowbox.pos = yellowbox.pos + yellowboxvelocity*dt

    t = t + dt
  #adds a point to the graph each iteration
    f1.plot(t,redbox.pos.x)
    f2.plot(t,yellowbox.pos.x)

print('time = ',t)
print('red position = ',redbox.pos.x)
print('yellow position = ',yellowbox.pos.x)