Activity Information
Learning Goals
- Demonstrate an understanding of how to write equations of motion, given constant velocity (position-time equation) ( HS-PS2-1)
- Develop proficiency in basic programming using the vPython language through GlowScript
Prior Knowledge Required
- Units
- Dimensional Analysis
- Constant Velocity Equation (Kinematics)
Code Manipulation
- Cut/Copy code
- Modify existing code
Activity
Handout – Colliding Crates
In this activity, you will be asked to complete several tasks involving what you have learned about describing motion and applying this knowledge to actual computer program code. In describing motion at this point, we need to consider both position and velocity. To keep this activity simpler, you will be working with constant velocity, either positive or negative.
First, you will need to go to GlowScript.org and create your own free account to begin adapting the computer code listed below. Next, select “create a new program” and copy and paste the code below to begin your adventure. Make sure you copy all of it.
- Change the size of the box to make it smaller.
- You will notice that the red crate is floating above the floor. Put this crate on the floor, far left side, by changing the code.
- Change the color of the crate.
- Give the crate a different constant velocity moving to the right.
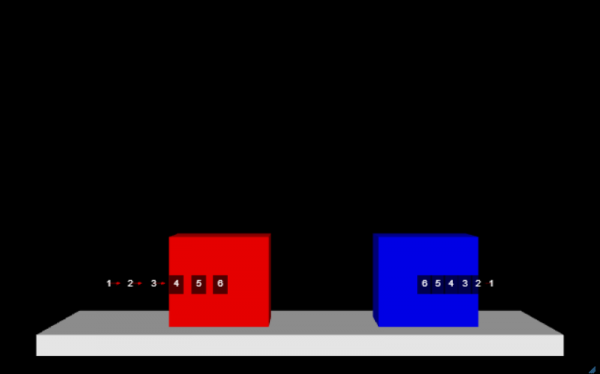
- Create a second crate, crate2, with a different size, color, and place it on the far right side of the floor.
- Give your second crate a velocity smaller in magnitude than the first crate moving to the left.
- Figure out how to stop the program once the crates collide, so that they don’t move past each other.
- Explain how you determined when the program was going to end.
- Which lines of code make the crates move?
- What kind of motion is being modeled with these lines of code?
- How could you make the crates meet sooner/later?
Code
GlowScript 2.7 VPython

#Creating the objects
floor = box(pos=vector(0,-30,0), size=vector(100,4,12), color=color.white)      #I've created the floor that the crate will slide across
crate = box(pos=vector(0,0,0), size=vector(20,20,5), color=color.red)           #I've created the crate, along with its dimensions and initial position resting on the floor

#Setting the time interval
t=0                                                                             #I've set the initial time to zero.
tf=0.940                                                                        #I've set the final time to 0, which gives the crate enough time to slide across the floor
dt=0.01                                                                         #I want my time interval set at 1/100th of a time unit

#Creates velocity vectors as a function of time
get_library('https://rawgit.com/perlatmsu/physutil/master/js/physutil.js')      #The program needed to know what a motion map is defined as
motionMap = MotionMap(crate, tf, 5, markerScale=0.1)                            #I want to display 5 arrows showing the motion of the crate

#Giving the objects an initial velocity
cratev=vector(75,0,0)                                                           #I'm defining the constant velocity of my crate to be 75 in the x-direction(left to right)
while crate.pos.x<35:                                                           #I want the crate to stop before it slides off the floor
    rate(50)                                                                    #This rate can speed up or slow down the replay
    crate.pos=crate.pos+cratev*dt                                               #I'm moving the crate by adding the change in position (cratev*dt) to the previous position (crate.pos)
    t=t+dt                                                                      #I'm updating the time

#This updates the velocity vectors
    motionMap.update(t,cratev)                                                  #This updates the motion map and display of the arrows as the crate slides across the floor

#This creates the graph of the kinetic energy of the crate
f1 = gcurve(color=color.blue)                                                   #Setting up a graph to show the kinetic energy of the crate as a function of time
for t in arange(0, 0.94, 0.01):                                                 # Time goes from 0 to 0.94 in 0.01 time intervals
    f1.plot(pos=(t,cratev.mag**2))	                                        # plot time vs. kinetic energy of the crate
Answer Key
Handout
- Edit the “size=vector(20,20,5)” segment of line 5
- Edit line 5, changing “pos=vector(0,0,0)” to “pos=vector(-40,-20,0)”
- Edit the “color=color.red” segment of line 5
- Edit the x-coordinate of the vector on line 17, “cratev=vector(75,0,0)”
- Create a line of code, similar to line 5, that says “crate2 = box(pos=vector(40,-20,0), size=vector(20,20,5), color=color.blue)”
- It might be helpful to rename the first crate to “crate1” for the sake of consistency
- Create a line of code, similar to line 17, that says “crate2v=vector(-15,0,0)”
- Change “while crate.pos.x<35:” on line 18 to “while crate2.pos.x-crate1.pos.x>20:”
- The crates will stop when the distance between them is 0. Theoretically, this would be encoded as “while crate2.pos.x-crate1.pos.x>0:”, however, this does not account for the width of the boxes. This is why the inequality “x>20” is used
- Line 20 is responsible for moving the crates
- Constant, 1-dimensional motion
- Altering the velocity of the crates (i.e. “cratev=vector(75,0,0)” in line 17) will change when and where they collide
Code
GlowScript 2.7 VPython

#Creating the objects
floor = box(pos=vector(0,-30,0), size=vector(100,4,12), color=color.white)      #I've created the floor that the crate will slide across
crate1 = box(pos=vector(-40,-20,0), size=vector(20,20,5), color=color.red)      #I've created the crate, along with its dimensions and initial position resting on the floor
crate2 = box(pos=vector(40,-20,0), size=vector(20,20,5), color=color.blue)

#Setting the time interval
t=0                                                                             #I've set the initial time to zero.
tf=0.940                                                                        #I've set the final time to 0, which gives the crate enough time to slide across the floor
dt=0.01                                                                         #I want my time interval set at 1/100th of a time unit

#Creates velocity vectors as a function of time
get_library('https://rawgit.com/perlatmsu/physutil/master/js/physutil.js')      #The program needed to know what a motion map is defined as
motionMap1 = MotionMap(crate1, tf, 5, markerScale=0.1)                          #I want to display 5 arrows showing the motion of the crate
motionMap2 = MotionMap(crate2, tf, 5, markerScale=0.1)

#Giving the objects an initial velocity
crate1v=vector(25,0,0)                                                          #I'm defining the constant velocity of my crate to be 25 in the x-direction(left to right)
crate2v=vector(-15,0,0)
while crate2.pos.x-crate1.pos.x>20:                                             #I want the crate to stop before it slides off the floor
    rate(50)                                                                    #This rate can speed up or slow down the replay
    crate1.pos=crate1.pos+crate1v*dt                                            #I'm moving the crate by adding the change in position (cratev*dt) to the previous position (crate.pos)
    crate2.pos=crate2.pos+crate2v*dt
    t=t+dt                                                                      #I'm updating the time

#This updates the velocity vectors
    motionMap1.update(t,crate1v)                                                #This updates the motion map and display of the arrows as the crate slides across the floor
    motionMap2.update(t,crate2v)

#This creates the graph of the kinetic energy of the crate
f1 = gcurve(color=color.blue)                                                   #Setting up a graph to show the kinetic energy of the crate as a function of time
for t in arange(0, 0.94, 0.01):                                                 # Time goes from 0 to 0.94 in 0.01 time intervals
    f1.plot(pos=(t,crate1v.mag**2))	                                            # plot time vs. kinetic energy of the crate