Activity Information
Learning Goals
- Apply Newton’s 2nd Law to relate the acceleration of a cart on a ramp to the forces acting on it
- Understand the relationship between acceleration, velocity, and position
- Develop a computational model of a cart on a ramp
Prior Knowledge Required
- Vector components
- Kinematics in 1d
- Newton’s second law
Code Manipulation
- Interpret existing code
- Edit existing code
- Copy / paste code
- Create new code from mathematical equations
Activity
Handout – Daring Dungeoneering
You and some of your best friends have been playing Dungeons and Dragons together for months, and your characters have finally made it to level 5! However, your most recent session ended with your characters in a precarious situation:
While escaping the vengeful Alagar the Defiler, your characters climbed into a minecart and sped off into the depths of an ancient mineshaft. Unfortunately, the minecart tracks eventually end at the top of a 100 m long slope. If your cart goes off the top of the slope, you and the cart will fall to your untimely demise. You need to know if your characters will be safe or if they need to jump off the cart.
To figure this out, you’ve decided to create a computational model of the scenario. Your Dungeon Master (the person who runs the game) is a bit of a physics nerd and has supplied you with this starter code. They’ve also told you that the slope is at an angle of 15 degrees to the horizontal and your cart starts at the bottom of the slope with a velocity of 22 m/s.
Additionally, they want your final code to create position, velocity, and acceleration graphs for the cart. Your code should also be generalized so it can work for many different possible angles and initial velocities, in case your characters are in a similar scenario again.
Code
Link – click “remix” to edit and view the code properly
GlowScript 3.0 VPython
#change these three values to match your scenario
#-----------------------------------------------------------------------------------------------------------------------------------------
tilt = 0.15 #amount of tilt - this value is in radians
cartstart = -50 #set the carts starting position between -50 and 50 - -50 for the left end, 50 for the right end - in meters
cartvelocity = 12 #initialize the carts initial velocity in meters/second
#-----------------------------------------------------------------------------------------------------------------------------------------
#define the view - change lines 13 and 14 to fit your monitor
scene.center=vector(0,0,0) #center the view
scene.width=600 #resize the width of the display window
scene.height=400 #resize the height of the display window
scene.camera.rotate(angle=tilt) #rotate view so it looks like ramp
positive=text(text = '+',pos=vector(60,10,0), height=5) #create a text label indicating the positive direction
negative=text(text = '-',pos=vector(-60,10,0), height=5) #create a text label indicating the negative direction
#define some things
t=0 #time in seconds
dt = 0.01 #time increment in seconds
cartaccel = 0 #initialize the cart's horizontal acceleration in meters/second/second
#create some objects
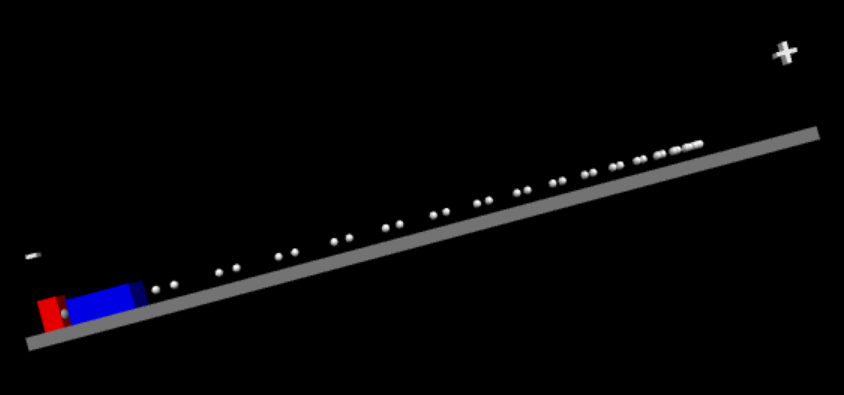
cart=box(pos=vector(cartstart,2,0), velocity=vector(cartvelocity,0,0), accel=vector(cartaccel,0,0), size=vector(10,4,4), color=color.blue, make_trail=True, trail_color=color.white, trail_type="points", interval=50, trail_radius=0.65) #create the cart as a blue box
ramp=box(pos=vector(0,-1,0), color=color.gray(0.5), size=vector(120,2,10)) #create the ramp for the cart to move on
motiondetector=box(pos=vector(-58.5,2,0), size=vector(3,6,2), color=color.red) #create the motion sensor at a position near the reference point facingin the positive direction
motiondetectorwindow=sphere(pos=vector(-57.5,2,0), radius=1, color=color.gray(0.7)) #create the ultrasonic sensor on the motion sensor
#create the graphs
ptgraph=graph(title='Position vs Time', xtitle='Time (s)', ytitle='Position (m)', ymin=-50, ymax=50) #create the PT graph
pt = gcurve(color=color.red, width = 5, label='Cart') #Cart PT curve
#create a loop to make things happen
while cart.pos.x <= 50:
rate(200) #rate statement to control the number of cycles per second the loop will operate at
cart.pos.x = cart.pos.x + cart.velocity.x * dt #update position of cart
pt.plot(t, cart.pos.x) #plot the graph of cart position vs time
t=t+dt #increment the timeAnswer Key
Handout
Converting to Radians
First, the code needs to take an input of degrees, not radians. To do this, the relationship that pi radians = 180 degrees can be used to find the equation:
x rad = (y degrees * pi)/180
In the code, this looks like:
tilt_degrees = 15               #amount of tilt in degrees
tilt = (tilt_degrees*pi)/180    #convert the amount of tilt to radians
Alternatively, the glowscript function radians() could have been used:
tilt = radians(tilt_degrees)Finding Acceleration
The acceleration of the cart needs to be found. Newton’s second law Fnet = ma => a = Fnet/m can be used. To find the net force on the cart, a free body diagram will be useful:
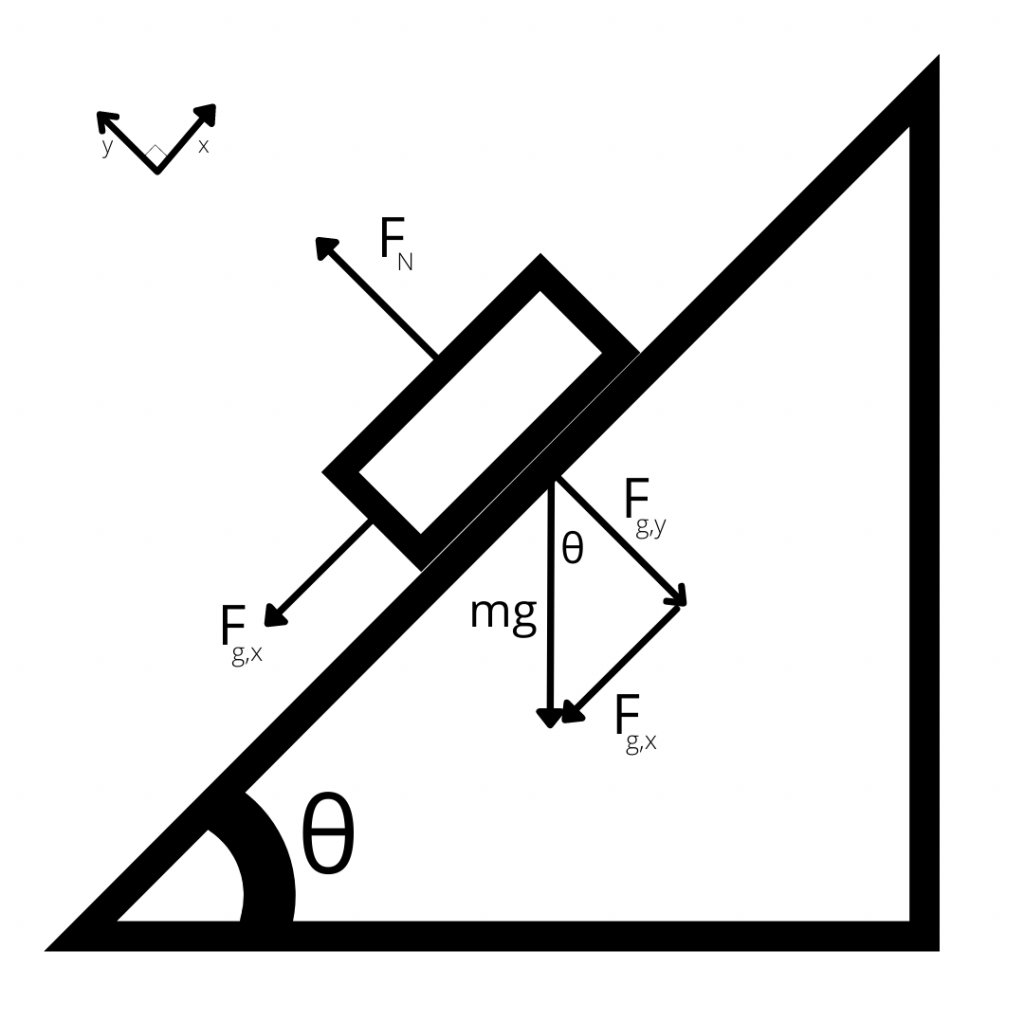
From this free body diagram, we can see that the net force on the cart is Fg,x which is equal to mg*sin(θ). This means that the acceleration of the cart will be equal to a = mg*sin(θ)/m = g*sin(θ).
This can now be added to the code:
g = 9.8                     #acceleration due to gravity
cartaccel = -g*sin(tilt)    #initialize the cart's horizontal acceleration in meters/second/second
Using the Acceleration
Now that the acceleration has been found, it can be used in the while loop. Acceleration is the change in velocity, so it is used update the velocity, much like the velocity is being used to update the position:
while cart.pos.x <= 50:
    rate(200)                                               #rate statement to control the number of cycles per second the loop will operate at
    cart.pos.x = cart.pos.x + cart.velocity.x * dt          #update position of cart
    cart.velocity.x = cart.velocity.x + cart.accel.x*dt     #update velocity of cart
Fixing the Condition Statement
Now the cart moves as expected, but the cart keeps moving off the ramp to the left. The code needs to stop running if the cart reaches the left side of the ramp. To do this, we can add to the condition statement for the while loop:
while cart.pos.x <= 50 and cart.pos.x >= -50:Huzzah! The heroes are safe.
Creating Graphs
To create the velocity and acceleration graphs, the lines of code that make the position graph can be duplicated and edited to display the appropriate quantities:
#create the graphs
ptgraph=graph(title='Position vs Time', xtitle='Time (s)', ytitle='Position (m)', ymin=-50, ymax=50)                #create the PT graph
pt = gcurve(color=color.red, width = 5, label='Cart')                                                               #Cart PT curve

vtgraph=graph(title='Velocity vs Time', xtitle='Time (s)', ytitle='Velocity (m/s)', ymin=-40, ymax=40)              #create the VT graph
vt = gcurve(color=color.blue, width = 3, label='Cart')                                                              #Cart VT curve

atgraph=graph(title='Acceleration vs Time', xtitle='Time (s)', ytitle='Acceleration (m/s/s)', ymin=-6, ymax=6)      #create the AT graph
at = gcurve(color=color.green, width = 3, label='Cart')
And in the while loop:
    pt.plot(t, cart.pos.x)      #plot the graph of cart position vs time
    vt.plot(t, cart.velocity.x) #plot the graph of cart velocity vs time
    at.plot(t, cart.accel.x)    #plot the graph of cart acceleration vs time
Code
Link – click “remix” to edit and view the code properly
GlowScript 3.0 VPython

#change these three values to match your scenario
#-----------------------------------------------------------------------------------------------------------------------------------------
tilt_degrees = 15               #amount of tilt in degrees
tilt = (tilt_degrees*pi)/180    #convert the amount of tilt to radians
cartstart = -50                 #set the carts starting position between -50 and 50 - -50 for the left end, 50 for the right end - in meters
cartvelocity = 22               #initialize the carts initial velocity in meters/second
#-----------------------------------------------------------------------------------------------------------------------------------------

#everything from here down does not need to be changed

#define the view
scene.center=vector(0,0,0)                                  #center the view
scene.width=600                                             #resize the width of the display window
scene.height=400                                            #resize the height of the display window
scene.camera.rotate(angle=tilt)                             #rotate view so it looks like ramp
positive=text(text = '+',pos=vector(60,10,0), height=5)     #create a text label indicating the positive direction
negative=text(text = '-',pos=vector(-60,10,0), height=5)    #create a text label indicating the negative direction

#define some things
t=0                         #time in seconds
dt = 0.01                   #time increment in seconds
g = 9.8                     #acceleration due to gravity
cartaccel = -g*sin(tilt)    #initialize the cart's horizontal acceleration in meters/second/second


#create some objects
cart=box(pos=vector(cartstart,2,0), velocity=vector(cartvelocity,0,0), accel=vector(cartaccel,0,0), size=vector(10,4,4), color=color.blue, make_trail=True, trail_color=color.white, trail_type="points", interval=50, trail_radius=0.65)   #create the cart as a blue box
ramp=box(pos=vector(0,-1,0),  color=color.gray(0.5), size=vector(120,2,10))                                         #create the ramp for the cart to move on
motiondetector=box(pos=vector(-58.5,2,0), size=vector(3,6,2), color=color.red)                                      #create the motion sensor at a position near the reference point facingin the positive direction
motiondetectorwindow=sphere(pos=vector(-57.5,2,0), radius=1, color=color.gray(0.7))                                 #create the ultrasonic sensor on the motion sensor

#create the graphs
ptgraph=graph(title='Position vs Time', xtitle='Time (s)', ytitle='Position (m)', ymin=-50, ymax=50)                #create the PT graph
pt = gcurve(color=color.red, width = 5, label='Cart')                                                               #Cart PT curve

vtgraph=graph(title='Velocity vs Time', xtitle='Time (s)', ytitle='Velocity (m/s)', ymin=-40, ymax=40)              #create the VT graph
vt = gcurve(color=color.blue, width = 3, label='Cart')                                                              #Cart VT curve

atgraph=graph(title='Acceleration vs Time', xtitle='Time (s)', ytitle='Acceleration (m/s/s)', ymin=-6, ymax=6)      #create the AT graph
at = gcurve(color=color.green, width = 3, label='Cart')                                                             #Cart AT curve


#create a loop to make things happen
while cart.pos.x <= 50 and cart.pos.x >= -50:               #while loop runs while cart is on the ramp
    rate(200)                                               #rate statement to control the number of cycles per second the loop will operate at
    cart.pos.x = cart.pos.x + cart.velocity.x * dt          #update position of cart
    cart.velocity.x = cart.velocity.x + cart.accel.x*dt     #update velocity of cart

    pt.plot(t, cart.pos.x)                                  #plot the graph of cart position vs time
    vt.plot(t, cart.velocity.x)                             #plot the graph of cart velocity vs time
    at.plot(t, cart.accel.x)                                #plot the graph of cart acceleration vs time

    t=t+dt                                                  #increment the time