Activity Information
Learning Goals
- Acceleration is the change in velocity
Prior Knowledge Required
- Vectors
- Kinematics in 1d
Code Manipulation
- Interpret existing code
- Create code from mathematical equations
- Edit existing code
Activity
Handout – Drag Race
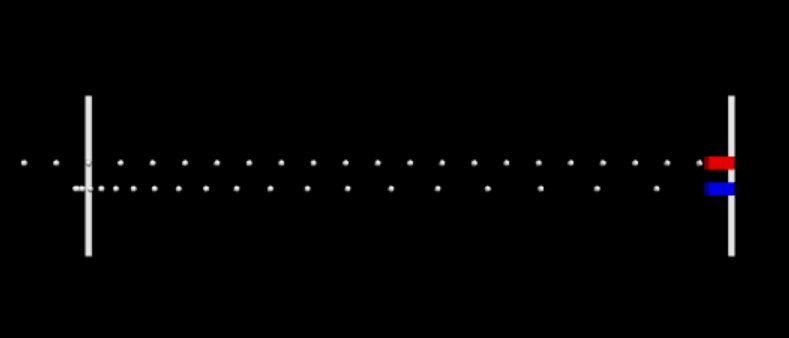
Your good friends Diana and Nora have decided to have a car race. They’ve asked you to use your physics knowledge to make a computational model that will predict who will win. They want it to show the motion of their cars and create graphs of their cars’ positions and velocities vs time. They have supplied you with some starter code that gives the basic setup for their race:
- The start line is located at x = -50 m and the finish line is located at x = 50 m
- Both of the cars are 4 m long. (In races, a vehicle finishes when its front reaches the finish line)
- Diana will start moving behind the start line and will travel at a constant 10 m/s.
- Nora will start from rest at the start line and will start accelerating at 2 m/s^2 toward the finish line when Diana gets to the start line.
Pre – Coding Questions
- How long will it take each car to reach the finish line? How did you find this without coding?
- If Nora instead accelerated at 2.1 m/s^2 how long would it take her to reach the finish line?
After you’ve answered these questions, start working on modifying the starter code so it functions properly, then answer the post-coding questions below.
Post – Coding Questions
- How did you get the first car to move?
- How did you get the second car to move?
- How were you able to have the second car start at the right time?
- How did you make it so the model stops when one of the cars reaches the finish line? How did you account for the length of the cars when doing this?
- Change the value of Nora’s acceleration to 2.1. Does the race have a winner now?
- Change Nora’s acceleration back to 2 and change the location of the finish line to 60 m. Why is there a winner now even though Nora’s acceleration and Diana’s velocity are unchanged?
Code
Link – click “remix” to edit and view the code properly
GlowScript 3.1 VPython

#set the view - you can adjust these for your screen
scene.width = 800
scene.height = 600
scene.range = 70

#define some things
t = 0       #initialize the time in seconds
dt = 0.01   #define the time increment in seconds
finish = 50 #set position of finish line in meters

#create the objects
car1 = box(pos=vec(-75,2,0),velocity = vec(0,0,0), accel = vec(0,0,0), color = color.red, height = 2, width = 2, length = 4)        #car1 (red) attributes (constant velocity)
car2 = box(pos=vec(-52,-2,0),velocity = vec(0,0,0), accel = vec(0,0,0), color = color.blue, height = 2, width = 2, length = 4)      #car2 (blue) attributes (changing velocity)
startline =  box(pos=vec(-50,0,0), height = 25, width = 0.1, length = 0.5)                                                          #create a line that will be where the two cars meet the first time
finishline = box(pos=vec(finish,0,0), height = 25, width = 0.1, length = 0.5)                                                       #create a line that represents the finish line

#create some graphs
grph1 = graph(title='Poistion vs Time', xtitle='Time (s)', ytitle='Position')        #create a velocity vs time graph
redpgraph = gcurve(color=color.red,  width = 2, label="Diana's Position (m)")        #define the curve for the red car
bluepgraph = gcurve(color=color.blue,   width = 2, label="Nora's Position (m)")      #define the curve for the blue car

grph2 = graph(title='Velocity vs Time', xtitle='Time (s)', ytitle='Velocity')        #create a velocity vs time graph
redvgraph = gcurve(color=color.red,  width = 2, label="Diana's Velocity (m/s)")      #define the curve for the red car
bluevgraph = gcurve(color=color.blue,   width = 2, label="Nora's Velocity (m/s)")    #define the curve for the blue car

#create a loop to make things happen
while car1.pos.x < 20:                       #create a while loop, other loop types can be used instead
    rate(200)                                #rate statement to slow things down so we can see them happen


    redpgraph.plot(t, car1.pos.x)            #plot the PT graph for the red car
    bluepgraph.plot(t, car2.pos.x)           #plot the PT graph for the blue car

    redvgraph.plot(t, car1.velocity.x)       #plot the VT graph for the red car
    bluevgraph.plot(t, car2.velocity.x)      #plot the VT graph for the blue car

    t = t+dt                                 #increment the time
Answer Key
Handout
Pre – Coding questions
- Consider the front of the cars as their positions. They are going to travel from x = -50 m to x = 50 m for a total distance of 100 m. Diana’s velocity will be constant so we can use the constant velocity equation to solve for her time:
v = d/t => t = d/v = 100 / 10 = 10 s
Nora will have a constant acceleration so we can use the kinematic equation: d = vit + 1/2at^2, noting that her initial velocity is zero:
d = 1/2at^2 => t = sqrt((2d)/a) = sqrt((2*100)/2) = 10 s
2. To find this we can use the equation from above again with a = 2.5 m/s^2, which gives t = 9.76 s
Post – Coding Questions
1. By using the position update equation in the while loop:
car1.pos.x = car1.pos.x + car1.velocity.x * dt # update position of car12. By using the velocity update equation and the position update equation in the while loop:
car2.velocity.x = car2.velocity.x + car2.accel.x * dt # update velocity of car2
car2.pos.x = car2.pos.x + car2.velocity.x * dt
3. By adding an if – else statement within the while loop that checks to see if Diana has reached Nora’s starting position:
car2start = car2.pos.x             #establish starting point for cart2 outisde of the loop

while car1.pos.x < 20:
    rate(200)

    if car1.pos.x <= car2start:        #check to see if car1 has passed car2
             car1.pos.x = car1.pos.x + car1.velocity.x * dt

     else:               #if car1 has already passed car2, do the following:
        car1.pos.x = car1.pos.x + car1.velocity.x * dt
        car2.velocity.x = car2.velocity.x + car2.accel.x * dt
        car2.pos.x = car2.pos.x + car2.velocity.x * dt
4. There are a few different ways to do this, but the easiest is to change the condition statement that initializes the while loop so that it is only true when the cars aren’t past the finish line:
while car1.pos.x and car2.pos.x < finish:Unfortunately, this doesn’t account for the length of the cars because glowscript considers the position of each object to be at its center. The boxes that represent the cars in this model are 4 meters long, which gives them a half-length of 2 meters. To add this to the code, we simply need to add 2 to the left side of the inequality above or subtract two from the right side:
while car1.pos.x and car2.pos.x < finish - 2: 5. Yes, Nora wins
6. By the time the racers get to the finish line previously, Nora was already travelling faster than Diana. Even if Nora stopped accelerating for the extra 10 m, Nora would win because she was moving with a greater velocity. If she continues to accelerate like in the model, she wins by an even larger margin.
Code
Link – click “remix” to edit and view the code properly
GlowScript 3.1 VPython

#set the view
scene.width = 800
scene.height = 600
scene.range = 70

#define some things
t = 0          #initialize the time in seconds
dt = 0.01      #define the time increment in seconds
finish = 50    #set position of finish line in meters

#create the objects
car1 = box(pos=vec(-75,2,0), velocity = vec(10,0,0), accel = vec(0,0,0), color = color.red, height = 2, width = 2, length = 4, make_trail = True, trail_color = color.white, trail_type = "points", trail_radius = 0.5, interval = 50)   #cart1 (red) attributes
car2 = box(pos=vec(-52,-2,0), velocity = vec(0,0,0), accel = vec(2,0,0), color = color.blue, height = 2, width = 2, length = 4, make_trail = True, trail_color = color.white, trail_type = "points", trail_radius = 0.5, interval = 50)  #cart2 (blue) attributes
start = box(pos=vec(-50,0,0), height = 25, width = 0.1, length = 1)                   #create a line that will be where the blue carts starts
finishline = box(pos=vec(finish,0,0), height = 25, width = 0.1, length = 1)           #create a line that represents the finish line
car2start = car2.pos.x                                                                #establish starting point for cart2

#create some graphs
grph1 = graph(title='Position vs Time', xtitle='Time (s)', ytitle='Position')       #create a velocity vs time graph
redpgraph = gcurve(color=color.red,  width = 2, label="Diana's Position (m)")       #define the curve for the red car
bluepgraph = gcurve(color=color.blue,   width = 2, label="Nora's Position (m)")     #define the curve for the blue car

grph2 = graph(title='Velocity vs Time', xtitle='Time (s)', ytitle='Velocity')       #create a velocity vs time graph
redvgraph = gcurve(color=color.red,  width = 2, label="Diana's Velocity (m/s)")     #define the curve for the red cart
bluevgraph = gcurve(color=color.blue,   width = 2, label="Nora's Velocity (m/s)")   #define the curve for the blue car

#create a loop to make things happen
while car1.pos.x and car2.pos.x < finish - 2:                #create a while loop, other loop types can be used instead
    rate(200)                                                    #rate statement to slow things down so we can see them happen

    if car1.pos.x <= car2start:                                  #check to see if car1 has passed car2
        car1.pos.x = car1.pos.x + car1.velocity.x * dt           #update position of car1

    else:                                                        #if car1 has already passed car2, do the following:
        car1.pos.x = car1.pos.x + car1.velocity.x * dt           #update position of car1
        car2.velocity.x = car2.velocity.x + car2.accel.x * dt    #update velocity of car2
        car2.pos.x = car2.pos.x + car2.velocity.x * dt           #update position of car2


    redpgraph.plot(t,car1.pos.x)           #plot the PT graph for the red car
    bluepgraph.plot(t, car2.pos.x)         #plot the PT graph for the blue car

    redvgraph.plot(t, car1.velocity.x)     #plot the VT graph for the red car
    bluevgraph.plot(t, car2.velocity.x)    #plot the VT graph for the blue car

    t = t+dt                              #increment the time